Crash Simulations in the Automotive Industry

Analysis of Crash Behavior

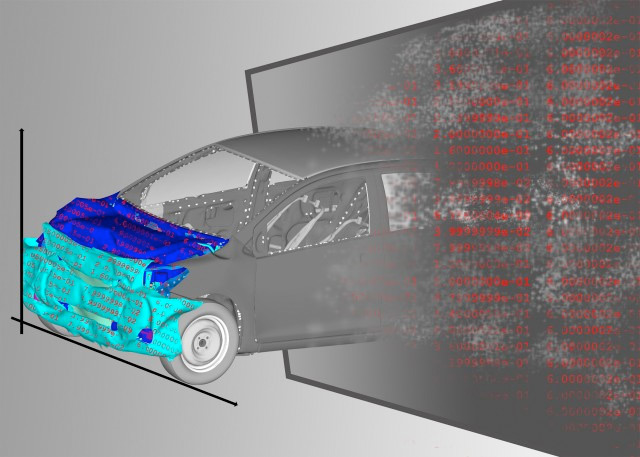
Virtual product development in the automotive industry uses numerical simulation to analyze the crash behavior of different design configurations. Among other things, material properties or component shapes are varied. Efficient software solutions exist for the evaluation of several simulation results, provided that only simple parameters such as curves, intrusion of the end wall at selected points, acceleration, etc. are investigated. Specialized 3D visualization software is used for the detailed evaluation of a single crash simulation.

Nonlinear Dimension Reduction

Industrial Product Development
© Fraunhofer SCAI

For the analysis of this complex amount of data, we use machine learning (ML) methods for so-called nonlinear dimension reduction in order to obtain a low-dimensional representation of the existing data. By a visual arrangement of the data concerning these few characteristic numbers  computed by ML procedures, a simple and interactive overview of the simulation results is possible. In particular, we have developed a method which calculates a few elementary and independent components from the data and thus enables the representation of a numerical simulation as its combination. This data-based representation can be understood as a kind of elementary decomposition of component geometries and allows a very compact and efficient representation. When considering crash simulations, elementary decompositions result, for example, in the rotation of a component or its global or local deformation in an area of the component, which also allows a physical interpretation of the analysis results. Thus, an investigation can be carried out efficiently because all simulations can be displayed and compared with the help of these elementary components.

Intuitive, interactive Visualization

Durch diese Reduktion der Datendimension ist eine intuitive, interaktive Visualisierung sehr vieler Simulationen realisierbar. Eine interpretierbare Anordnung in drei Koordinaten bezüglich ausgewählter Elementarzerlegungen zeigt die Unterschiede zwischen den Simulationen, beispielsweise die verschiedenen Geometrieverformungen beim Crash. Als Beispiel betrachten wir ein digitales Finite-Elemente-Modell eines Pick-Up-Trucks, welches wir im BMBF-Big-Data-Projekt VAVID untersucht haben. Simuliert wird ein Frontal-Crash, wobei die Blechdicken von Bauteilen variiert werden. Analysiert werden die Verformungen der Längsträger. Die neue Repräsentation bezüglich der berechneten Elementarzerlegungen ermöglicht es, die verschiedenen Verformungen als Summe elementarer Komponenten kompakt und interpretierbar darzustellen.

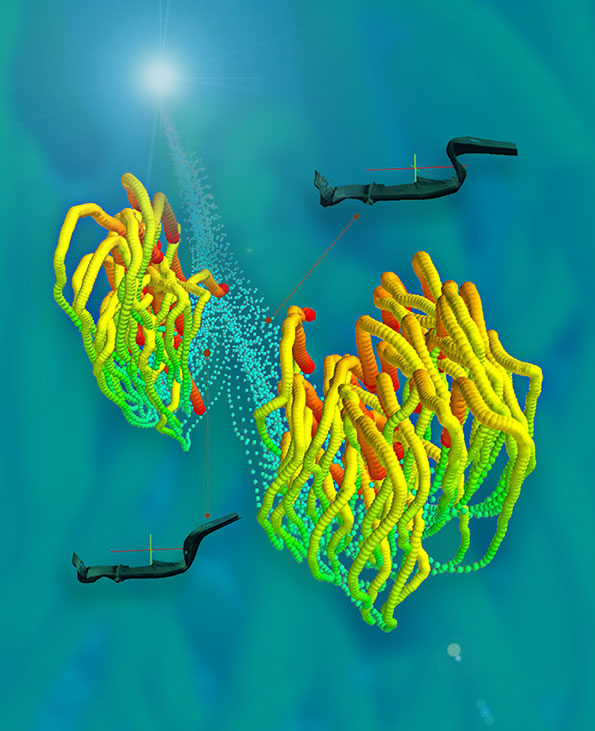
By this reduction of the data dimension, an intuitive, interactive visualization of many simulations is realized. An interpretable arrangement in three coordinates with respect to selected elementary decompositions shows the differences between the simulations, for example the different geometrical deformations during a crash. As an example, we consider a digital finite element model of a pick-up truck, which we investigated in the BMBF Big Data project VAVID. A frontal crash is simulated in which the sheet thicknesses of components are varied. The deformations of the longitudinal beams are analyzed. The new representation with respect to the calculated elementary decompositions makes it possible to present the various deformations as the sum of elementary components in a compact and interpretable way.

Analysis of the Simulation Results

For each simulation, we consider about one hundred intermediate time steps over, which are visualized simultaneously, something that was not possible with previous analysis methods. Our ML method can visualize the temporal development of the crash behavior in a catchy way by means of these components.  


Machine Learning
© Fraunhofer SCAI

Each point represents a simulation at a specific time step. It can be clearly seen how all simulations start with the same geometry and how two different forms of crash behaviour develop over time, illustrated by typical deformations of the longitudinal beam under consideration. In addition, the time of this splitting can be approximately identified. On the basis of such an analysis of the simulation results, the development engineer can better decide how design parameters are to be selected.

In addition, new digital measurement methods have been developed in recent years which make it possible to obtain high-resolution time-dependent 3D data from a real crash test. For the first time, the newly developed methods allow the comparison between simulations and precise measurement data from a real experiment. In this way, the most suitable numerical simulation for a real crash test can be identified, which was previously not possible in this quality. Thus it is now possible to gain an overview of all simulations and to determine whether, in analogy to, a real experiment follows the left or right deformation path in the simulation space.