Sarah Mubeen
Decoding the results of pathway enrichment analysis
In this post, doctoral student, Sarah Mubeen, outlines her recent work on a web application to assist researchers in the interpretation of high throughput data with popular pathway analysis methods, such as GSEA and ORA. Her user-friendly tool will soon be available online.
Currently, high throughput (HT) technologies (where tens of thousands of samples undergo simultaneous testing for measurements of gene expressions levels) output such massive volumes of data, researchers are often left with the daunting task of finding if there are any meaningful patterns in the data at all and how they can be extracted. With a host of these technologies, datasets and tools at hand, researchers can address some of their key research questions (e.g., is there a difference between two populations as opposed to none? How can it be measured? Why did it arise?)
A simple approach to confront these sorts of questions is to look at a single gene at a time and determine whether or not it’s significantly differentially expressed. But, this approach can lack context; what if the cumulative effect of a large number of genes that are slightly altered is greater than the effect of a single one? Thus, a more holistic approach is to consider sets of genes, as opposed to individual ones.
What can particularly guide the interpretation of HT data is determining if these sets of differentially expressed genes might be associated with a given biological process or a phenotype. This is commonly done through a pathway analysis (such as gene set enrichment analysis (GSEA) or over representation analysis (ORA)). While pathway analysis has certainly become a highly popular approach, it can come with an important caveat: the pathway database a researcher chooses can impact the results of various pathway analysis.
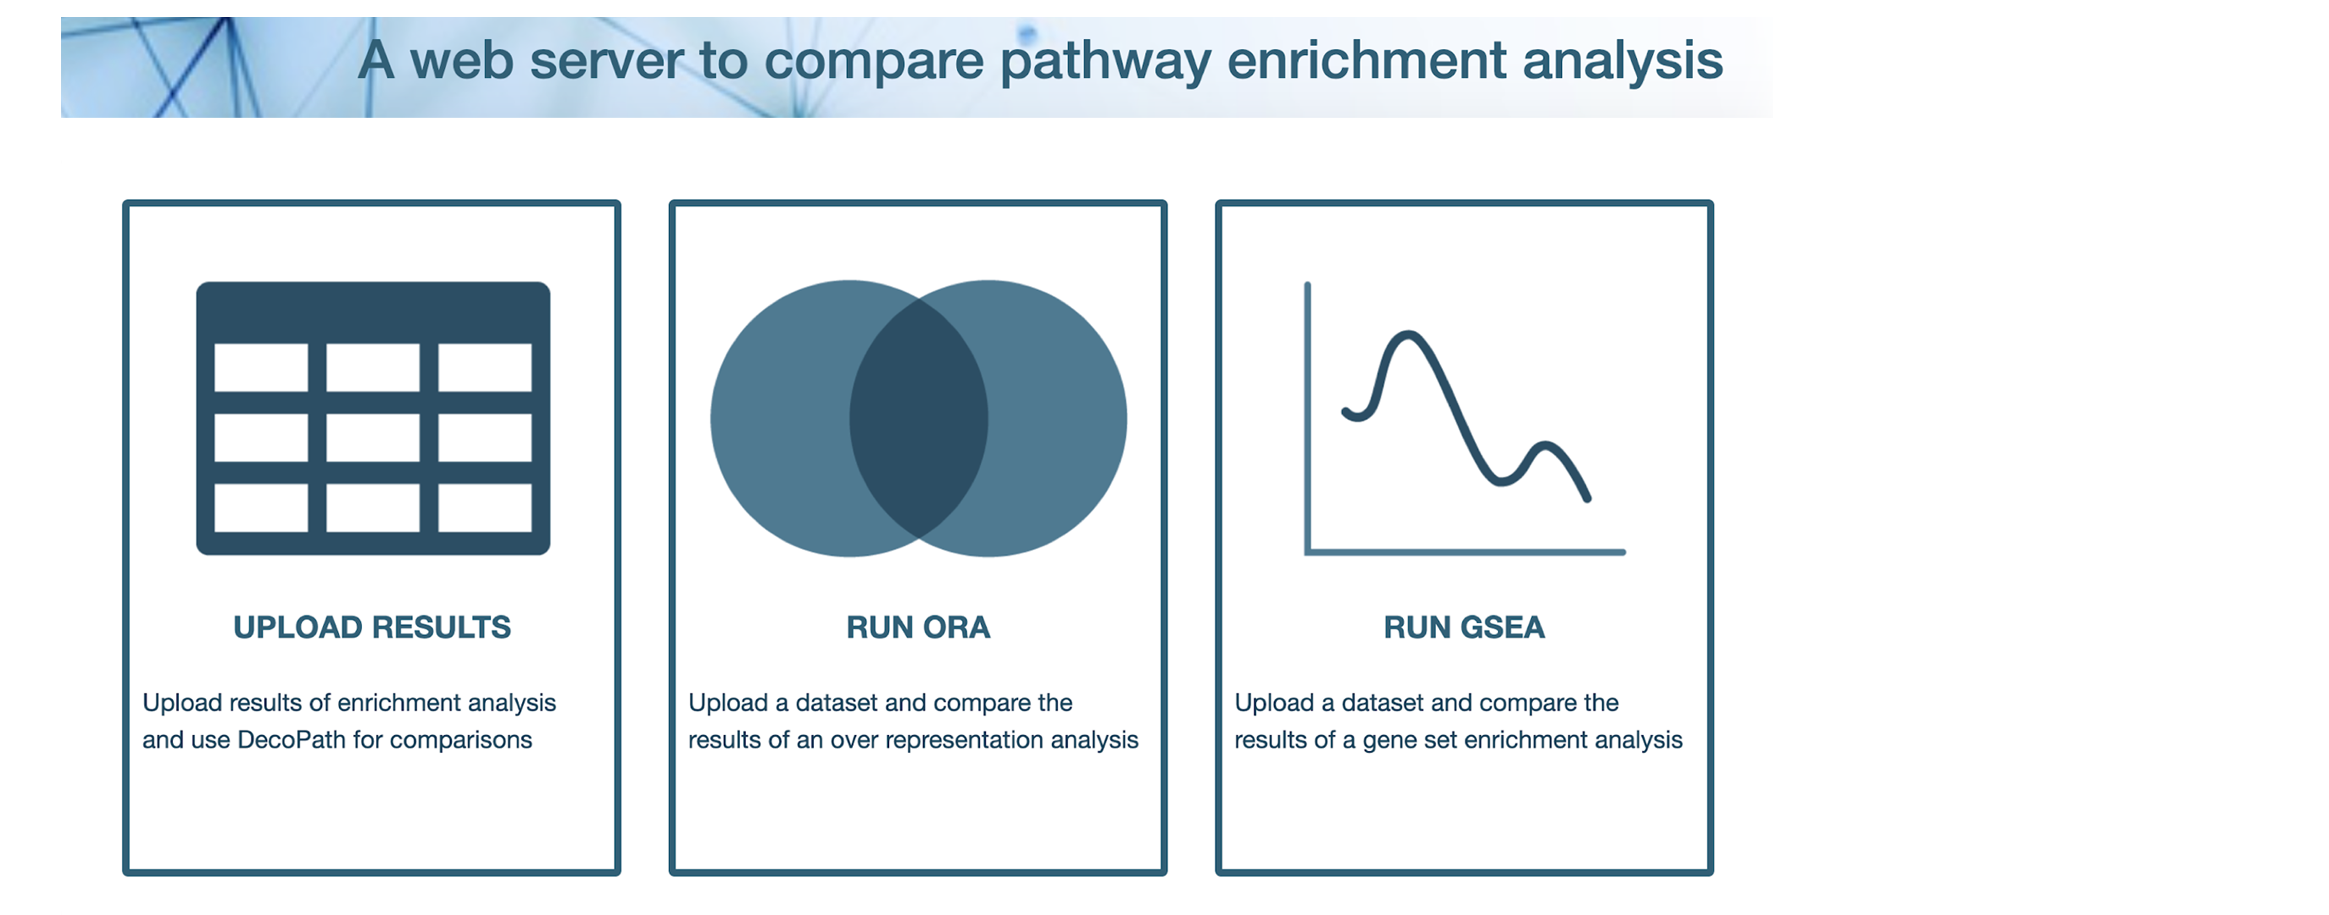
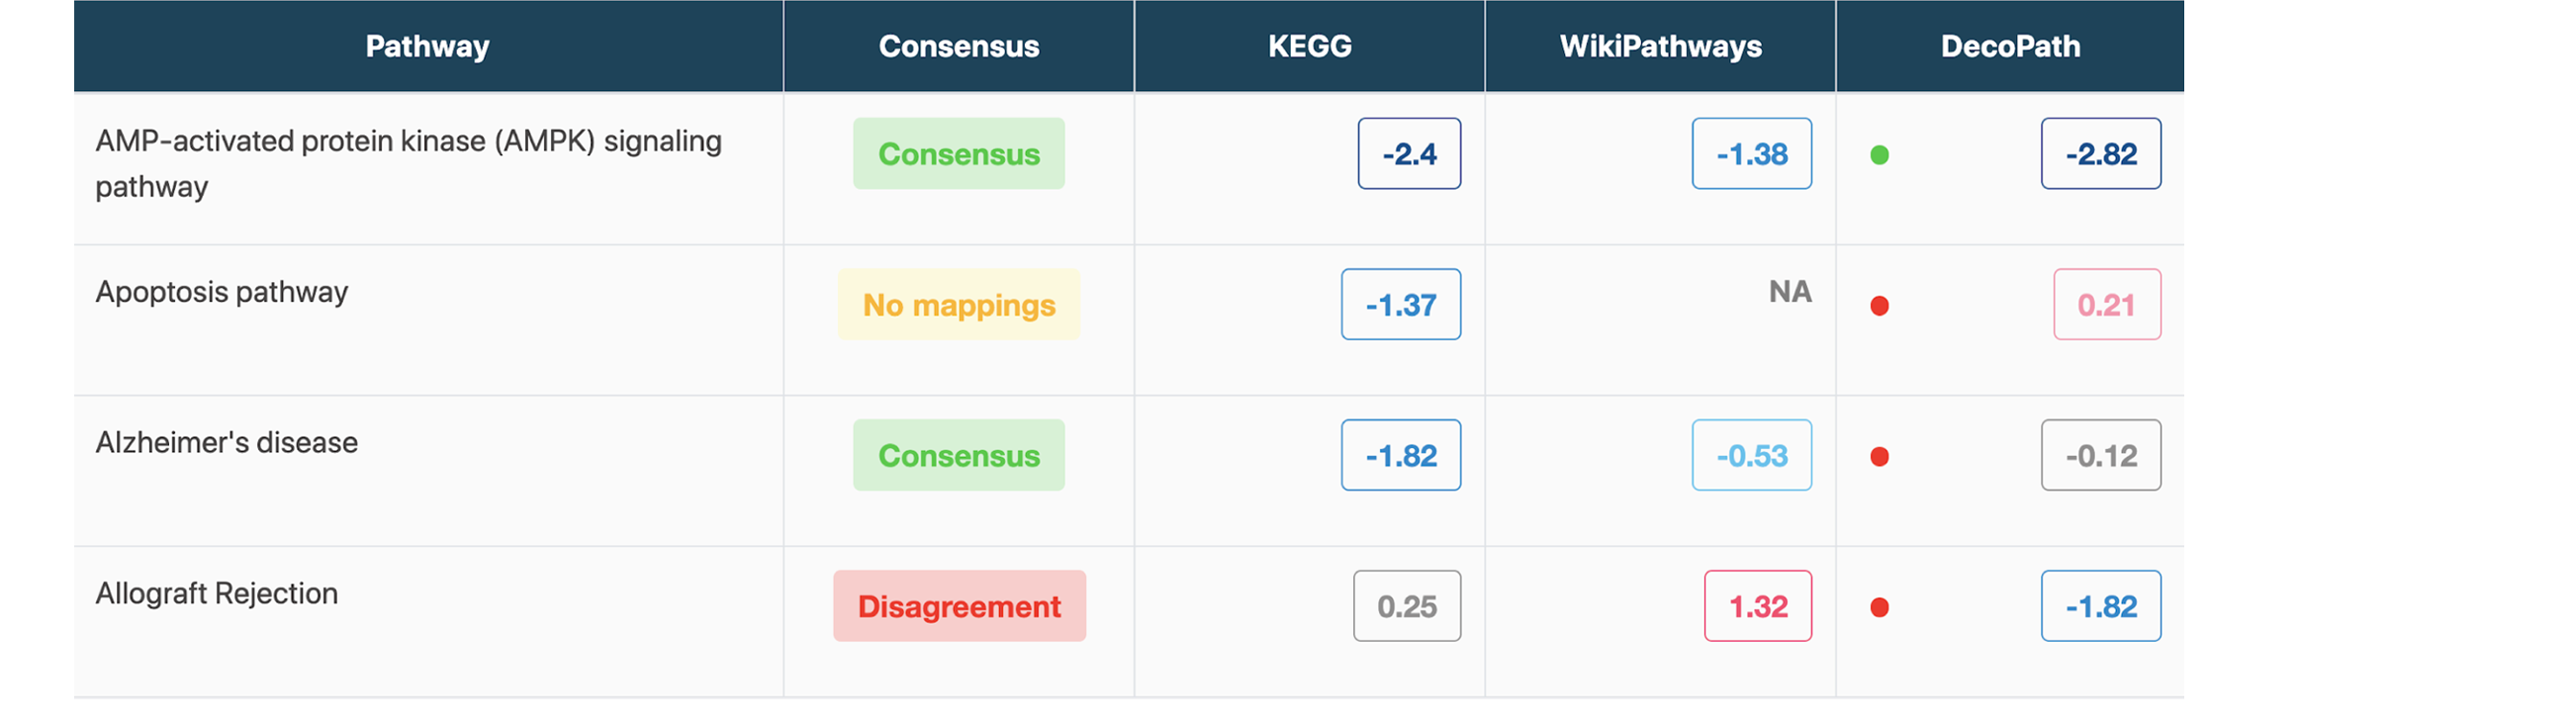
To shed light on what exactly a researcher can expect when they use a particular database for a pathway analysis over another, we’ve developed a web application that can be used to identify where differences lie by comparing the results generated when pathways from different resources are used (see the screenshots below). Interactive visualizations will also allow researchers to explore the specific genes in various gene sets which lead to contrasting results.
Our tool will be made publicly available in a few weeks’ time. Stay tuned!