Aya Abdelbaky
Graph neural network for disease diagnosis prediction
Master’s student Aya Abdelbaky describes the work she has submitted on prediction of disease diagnosis using graph neural networks on transcriptomics data.
Motivation
Gene expression levels tell us about the activity of genes at a certain time point, and can be used to infer which pathways are up- and downregulated. This transcriptomic type of data can be used to characterise diseases, and stratify patients into different disease subtypes or into different disease stages. Therefore, the expression of certain genes can be used as biomarkers for disease diagnosis and development. Another important characteristic of gene expression is that genes are usually not expressed individually, but they are expressed in groups or in correlation to one another. We can represent this network of gene expression interactions using a graph, a commonly used data structure in the field of computer science.
Graph classification for patient diagnosis prediction
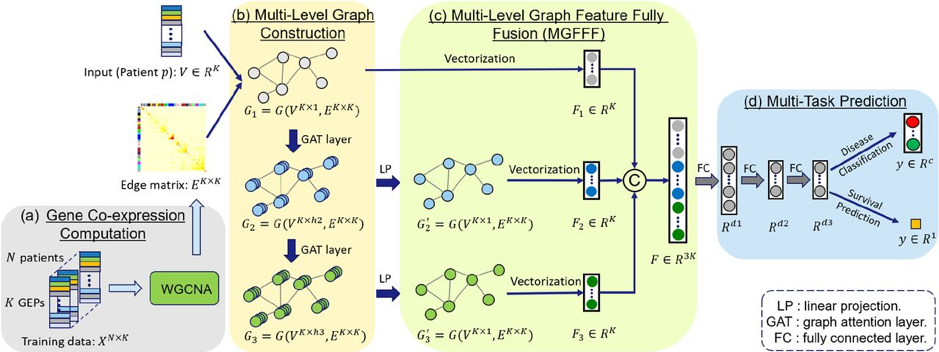
When we take a graph perspective, we can represent a patient in terms of their gene expression levels as a connected network. Nodes in this network can represent genes, their feature can be the gene expression, and an edge can exist between two nodes if they are correlated with each other. This concept is used in a graph neural network (GNN) based approach by Xing et al. (Xing et al., 2022), shown in Figure 1. The idea is to enrich GNNs with weighted co-expression networks to predict a disease diagnosis of a patient.
GNNs are, broadly speaking, neural networks that operate on graph-structured data. GNNs update the representation of a node in the graph by aggregating the representation of the neighbouring nodes and using an update function. Here we used Graph Attention Networks (GAT), where a weight is given to each neighbouring node according to its effect, correlation or degree of contribution to the target node. We built the model to perform a graph classification task, whereby a subgraph is constructed for each patient and each node represents the gene expression of that particular gene. Edges exist between genes with similar expression profiles above a certain threshold. Based on the covariance between genes, we can identify clusters of genes with similar expression profiles to form a co-expression network. Our GNN model uses these graphs as input for the prediction of the diagnosis of each patient.
After predicting the most likely diagnosis for patients, we wanted to try and explain our models’ predictions. We calculated the SHAP values (Lundberg & Lee, 2017), which show the contribution of each input feature on the prediction of the model. We therefore identified important genes and biological modules which are important to each prediction of disease diagnoses.
A potential application for our developed models is to use them for identifying the genes that have biological significance to the disease in question. This can be the first step in disease diagnosis, prognosis and treatment as well as identifying biomarkers and the basis for personalised medicine.
References:
Lundberg, S., & Lee, S.-I. (2017). A Unified Approach to Interpreting Model Predictions (arXiv:1705.07874). arXiv.
https://doi.org/10.48550/arXiv.1705.07874
Xing, X., Yang, F., Li, H., Zhang, J., Zhao, Y., Gao, M., Huang, J., & Yao, J. (2022). Multi-level attention graph neural network based on co-expression gene modules for disease diagnosis and prognosis. Bioinformatics (Oxford, England), 38(8), 2178–2186.
https://doi.org/10.1093/bioinformatics/btac088